

4 Recruitment Analytics Templates to Track Your Progress
Love it or hate it, data is at the heart of every successful company.
From how many hires you made last week, to your employee retention rates, knowing where your company stands is key to knowing where you’re going next.
But the numbers are just the beginning—it’s what you do with them that really counts.
The more you know about your recruitment process, the more you can do to improve it.
That’s where recruitment analytics comes in, and why getting to know your hiring funnels from your sourcing reports is recruitment best practice 101.
In other words, it’s time to get friendly with HR analytics.
And this ebook will help you do just that. Whether you’re curious about why analytics should be on your to-do list or how reporting actually works, we’ve drilled down deep to answer the questions guaranteed to turn you into a true recruitment analytics wizard.
Why should I care about recruitment analytics?

The more you know about your recruitment process, the more you can do to improve it.
In fact, recruitment analytics are your best friend when it comes to understanding the ins-and-outs of your hiring process—so you can improve the experience for candidates and company.
Here are some other reasons why today’s recruitment is all about analytics:
They help you pinpoint your hiring obstacles: If you know where you’re tripping up, you can deal with it. Analytics are awesome for highlighting challenging areas and showing where you’re acing it. Who wouldn’t want to know that?
Analytics save you time: Once you know how long each stage of your hiring process takes, you can work on reducing it. Simple.
And help you stay ahead of the game: Do you want to leap ahead of the competition? Of course you do! With the right recruitment analytics you can start to pick up on industry trends and predict where they’re headed next.
What are the key recruitment analytics templates to use?
There are a ton of ways to measure data. The trick is picking the ones that deserve your time and attention.
Here’s a list of key metrics you need to know and some easy-to-use tactics to implement them:
Pipeline metrics
What is it for?
Hiring in 2020 is all about efficiency—that means tracking your candidates from day one.
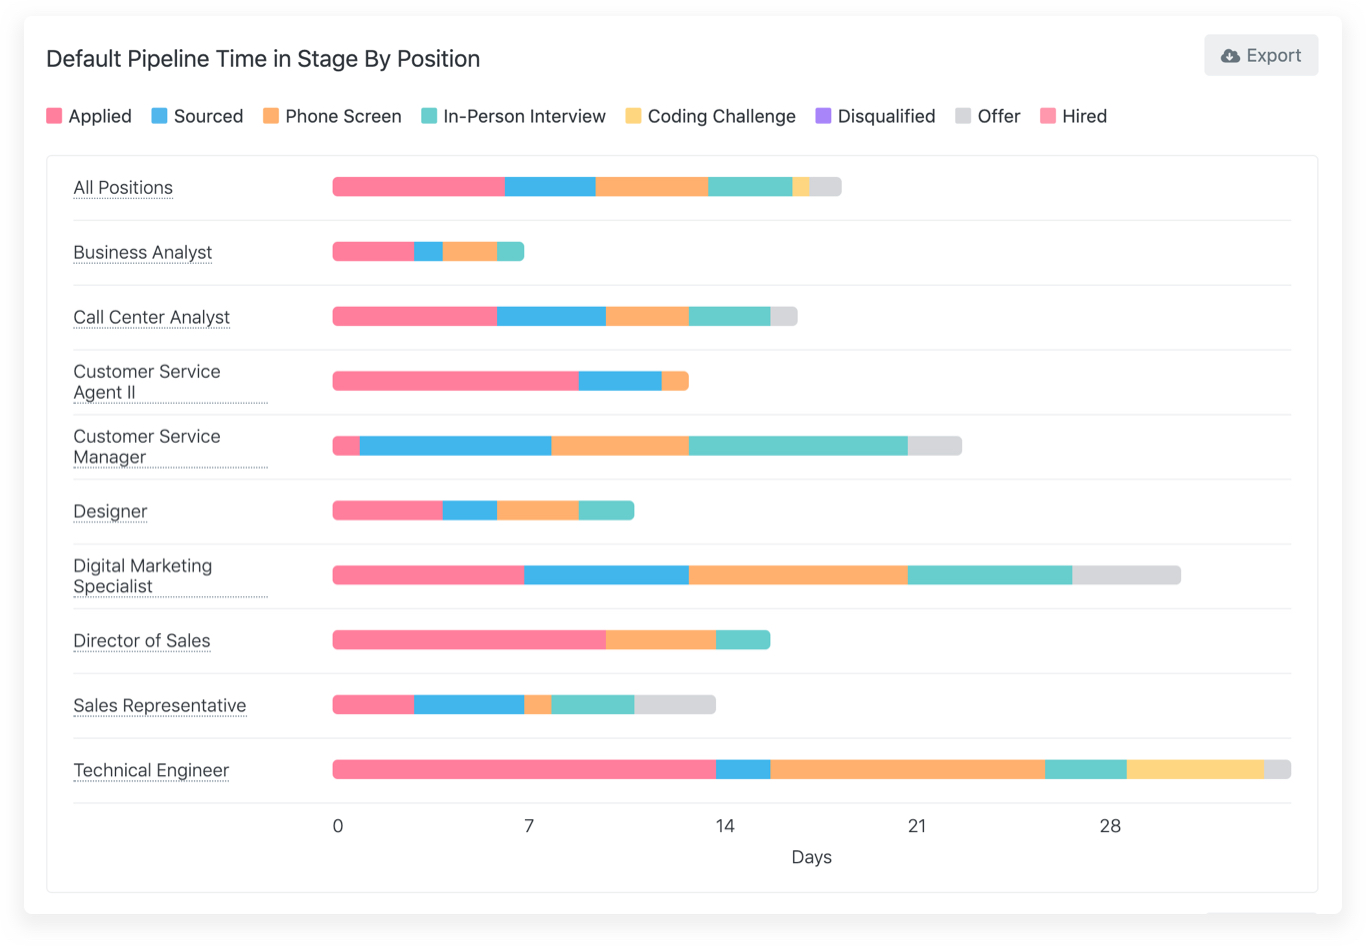
Pipeline metrics help do this by keeping count of candidates at each stage of the recruitment process, so you can track how long it takes to move each individual forward (or not).
You can also compare reports by job title or department to see how long it takes to hire—then concentrate your efforts on the roles and departments that need it.
How does it work?
To ace your own pipeline reports, you need to track the exact numbers and percentages of candidates moving forward in the process plus how long it takes.
The most useful reports are Pipeline Funnel Progression, Pipeline by Position and Pipeline by Department—which means you need to keep track of how many and when candidates move forward plus how long it takes each department to fill a role.
Honestly, this can be a major time-suck. ⌛
That’s why any ATS worth its weight will offer automatic pipeline reports—saving you precious time and money on back-breaking tracking work.
Pipeline metrics help you answer the following questions:
- How long does it take each department to fill a role?
- At what stage do we weed out most of our applicants?
- Are we moving more candidates forward through the phone screen after we relaxed some of the requirements?
Source Reports
What is it for?
If you’ve ever wondered exactly where your applicants come from, you’re going to LOVE Source Reports. 💞
Source Reports allow you to see how many applicants come from each job board or elsewhere, so you can see what works (and what doesn’t!)
How does it work?
Unfortunately, because most applicants come through online portals, you can’t DIY your own Source Reports.
But luckily, there are plenty of tools out there that can do it for you. 🙌
Here are a couple of friendly neighborhood software platforms for your toolbox:
Job board analytics: Some job boards (like Indeed, Glassdoor or Linkedin) track certain analytics for you. The Good News: Most of them will show how many people have read the ad and which candidates applied through their portal. The Bad News: You won’t catch those candidates who head straight to your website via the job board link unless you head to your web analytics—and honestly, getting accurate stats this way is a chore. 😴
Your ATS: The best ATS systems will allow you to automatically push ads to a bunch of job boards in one click. The Good News: You can see which job boards get your ad the most attention and find out exactly where ALL of your applicants have come from. The Bad News: There is no bad news.
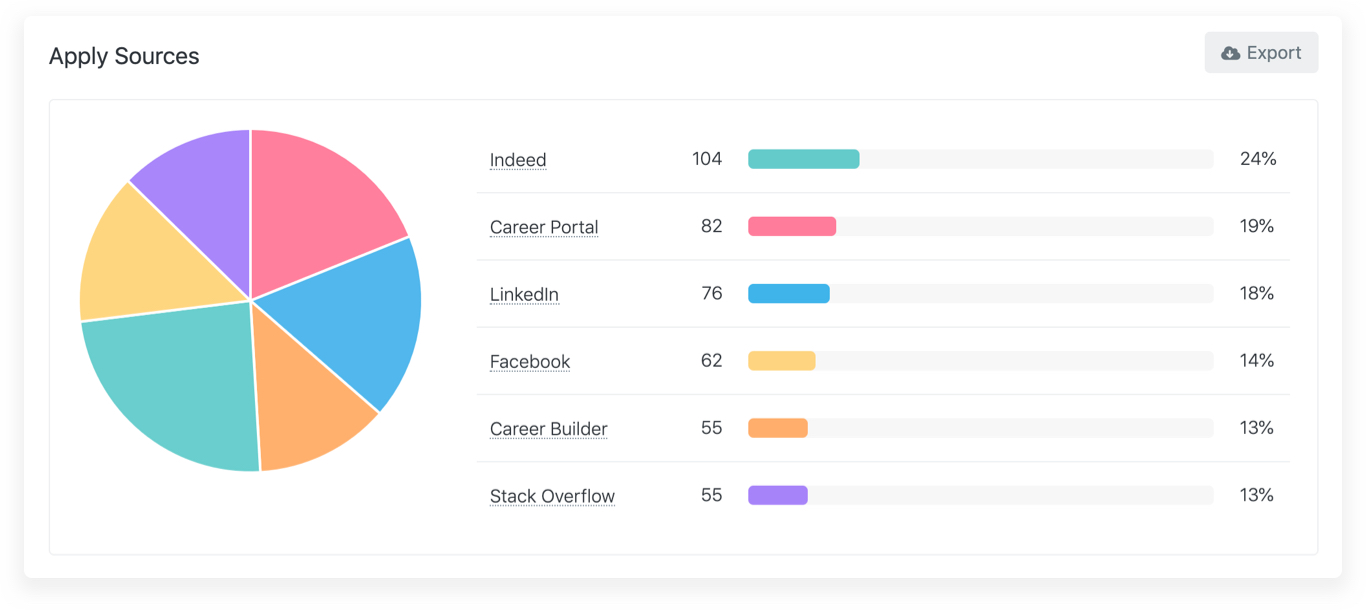
Source reports help you answer the following questions:
- How have our application metrics changed over time?
- Are our job ads pulling in enough applications?
- Which job board is the most effective?
Time-to-Fill Reports
What is it for?
All true recruitment pros know time is everything.
That’s why tracking how long it takes to fill a role is SO important.
You can use this metric to figure out how efficient your processes are and pinpoint obstacles in the recruitment process—then, it’s all about reducing your time-to-fill.
The outcome? You’ll figure out ways to streamline your process, save precious time and gain awesome rockstar candidates.
How does it work?
If you’re one of the lucky ones, your ATS will automatically generate a full time-to-fill report for you.
If not, you can do it the old-fashioned way and calculate your time-to-fill manually using this formula:
Time-to-fill reports answer the following questions:
- Are our roles taking too long to fill?
- How efficient is the recruitment process?
- At what point do we encounter most obstacles?
Quality of Hire Metrics
What’s it for?
When it comes to becoming a recruitment analytics pro, quality of hire is your ace in the sleeve.
According to Linkedin’s Future of Recruiting report, 88% of recruiters agree quality of hire (QoH) is the key metric to watch.
Here are a few awesome things you can do with quality of hire:
- Discover the value employees bring to the company.
- Compare your employee value with the national or industry average to see how you’re doing.
- Make strategic hiring decisions that’ll see your productivity soar. 📈
How does it work?
There’s a lot you need to know before diving in with this one—and you’ll need a bunch of indicator metrics before you can gauge your final percentage.
Once you’ve got the hang of it though, QoH is easy.
Here are some of the indicator metrics to work with—bear in mind you’ll need to create a scoring system to mark each one out of 100 (check out our QoH number-crunching article for the full list of indicator metrics to work with):
- Time-to-fill
- Assessment and aptitude tests
- Job performance
- Employee retention rates
Once you’ve got all (or some) of these metrics in place, here’s your formula:
You can use this formula for individual employees or the entire company, simply use individual-employee indicator scores or the averages of all employees.
Quality of hire metrics help answer the following questions:
- What is the value of a particular job role?
- Is [a role] worth the time and money put into hiring?
- How does our hiring process compare with the competition?
Track your HR analytics like a true recruitment wiz
Now that you know the key metrics to watch, it’s over to you.
From identifying hiring obstacles with your newfound time-to-fill knowledge, to using source reports to find the best job boards, the recruitment world is now your oyster.
No matter which reports you choose to use, remember you’re in it to win it—and acing your reporting will help you become an A-player recruitment wizard.
Start optimizing your recruiting process today.
Breezy HR is end-to-end recruiting software to help you attract & hire great employees with less effort. We believe HR should be fun, easy, and most of all, human.